Latest Information
*** This page no longer being updated as Government websites that gave us the info no longer being updated ****
Sad to see that in the last two weeks (up to 21 Sep) Lowdham Bleasby and Gunthorpe have has the 2nd highest recorded cases in Newark & Sherwood. There have been 8 in last two weeks having only been 3 since the pandemic began. (Previously the figures had reported 4 in each of last 3 weeks but this was later corrected on Government data)
Local Information
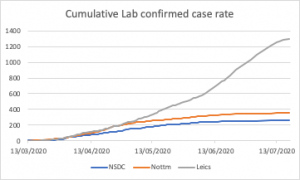
The recent experience of Leicester shows it is important to look at local as well as national information. There is the potential for a lockdown at any time and very little notice may be given. It is unclear how any such lockdown would work in Nottinghamshire eg would it just be Nottingham or a district councils such as Newark & Sherwood or would it be county wide. The trend does seem to be an important factor. This page shows two measures which we think are useful in determining the impact on Lowdham as part of Newark & Sherwood District within Nottinghamshire.
R NUMBER
There is now some county based information on the R number which may be available weekly. Often local newspapers report the latest figures such as West Bridgford wire and Nottingham Post. The plan is to show these figures on this site but there may be more current info available elsewhere on the web.
As at 26 Aug Nottinghamshire R rate is 0.9 to 1.1 (down from 0.9 to 1.3), the Midlands 8.0 to 1.1 and the growth rate is between -3% and =1%.
There is also a Government website which is regularly updated and gives a regional R number. Site is here
Previous Nottinghamshire R numbers : 24 July 0.8 to 1.2; 1 Aug 0.7 to 0.9; 19 Aug 0.9 to 1.3
TESTING
There is now local information available covering Nottinghamshire, Nottingham and Newark & Sherwood District Level.Due to the variations in population size it is best to look at cases per 100 thousand resident population. This is available on the main government info website ( https://coronavirus.data.gov.uk ) but you have to choose the right filters (LTLA = Newark and Sherwood). The data gives up to date information but no trend. Data on total cases is also available on Nottingham Post and West Bridgford wire.
We will periodically update the trend data below, let us know if you think other data would be more useful.


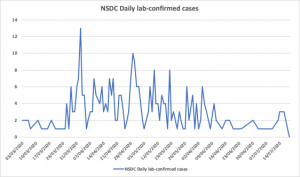
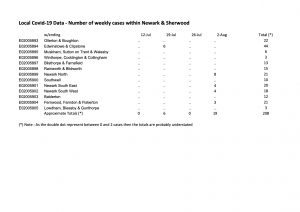
The latest data is now on these three links Latest N+S Info and Cumul rate (webpage) and Local Info. (we update the figures based on the Government data)
A fuller explanation is below
There is a lot of government information at https://coronavirus.data.gov.uk but the format does change as it gets improved. To look at the number of cases choose “cases” on the left hand menu. This gives at least two insights
First insight – Daily info (but only down to District Council level)
- Where it says “Cases in United kingdom”, click the blue drop down.
- In area type choose ‘Local Authority’.
- In area name scroll down to the District eg ‘Newark and Sherwood”.
- The graph (in “Daily” mode ) shows the trend of the number of cases and a 7 day average – good for spotting any potential 2nd spike
- Quick link is here
- If you choose “Data” (or the download arrow) you can access the raw info to draw your own graphs.
Second insight – Weekly Info but more detailed (within a District Council) and hides ‘small’ data
- On the ‘cases’ tab scroll down to “Weekly cases by local area in England” and click on the map. Direct weblink is https://www.arcgis.com/apps/webappviewer/index.html?id=47574f7a6e454dc6a42c5f6912ed7076
- This uses colour to show the number of weekly cases per area – and the areas are much smaller than the Districts.
- Put your postcode in the top left hand box and it shows data for your area
- This shows if there are outbreaks near you as well as in your area.
- One issue is that if there are 0, 1 or 2 cases in a week then the data shows as dots ‘..’ This means that if you see the “dots in the data” or “nothing on the map” you can not assume there are no cases – just that there are less than three!
- There is also a data download option. If you open it in Excel you can see the areas within each District with a weekly total. Interesting data – but the data is only weekly.
- The data does show there has only been one week there were three cases or more in “Lowdham, Bleasby and Gunthorpe” and they were all in week of 27thApril to 3rd
- This granularity of data shows that the recent (w/e 2nd August) spike in Newark & Sherwood was in Newark.
